Week 4(23/7/18 - 27/7/18)
As a part of Udemy course's assignment we implemented the code of Blackjack card game by using Objects and classes in Python.
Blackjack Game Play
To play a hand of Blackjack the following steps must be followed:
- Create a deck of 52 cards
- Shuffle the deck
- Ask the Player for their bet
- Make sure that the Player's bet does not exceed their available chips
- Deal two cards to the Dealer and two cards to the Player
- Show only one of the Dealer's cards, the other remains hidden
- Show both of the Player's cards
- Ask the Player if they wish to Hit, and take another card
- If the Player's hand doesn't Bust (go over 21), ask if they'd like to Hit again.
- If a Player Stands, play the Dealer's hand. The dealer will always Hit until the Dealer's value meets or exceeds 17
- Determine the winner and adjust the Player's chips accordingly
- Ask the Player if they'd like to play again.
Session with Vikram Sir
This week we were introduced to our mentor Vikram Jha who is a Kaggle master and also Founder and CEO of Pucho company based in Bangalore.
After a brief introduction, he told us about the importance of EDA (Exploratory Data Analysis) and feature engineering in machine learning and also introduces us to various data visualization tools and the techniques of feature engineering.
Exploratory Data Analysis
Exploratory data analysis (EDA) is an approach analyzing data sets to summarize their main characteristics, often with visual methods. A statistical model can be used or not, but primarily EDA is for seeing what the data can tell us beyond the formal modeling or hypothesis testing task.
Value of Exploratory Data Analysis
Exploratory Data Analysis is valuable to data science projects since it allows to get closer to the certainty that the future results will be valid, correctly interpreted, and applicable to the desired business contexts. Such level of certainty can be achieved only after raw data is validated and checked for anomalies, ensuring that the data set was collected without errors. EDA also helps to find insights that were not evident or worth investigating to business stakeholders and data scientists but can be very informative about a particular business.
EDA is performed in order to define and refine the selection of feature variables
that will be used for machine learning. Once data scientists become familiar with the data set, they often have to return to feature engineering step, since the initial features may turn out not to be serving their intended purpose. Once the EDA stage is complete, data scientists get a firm feature set they need for supervised and unsupervised machine learning.
Methods of Exploratory Data Analysis
It is always better to explore each data set using multiple exploratory techniques and compare the results. Once the data set is fully understood, it is quite possible that data scientist will have to go back to data collection and cleansing phases in order to transform the data set according to the desired business outcomes. The goal of this step is to become confident that the dataset is ready to be used in a machine learning algorithm.
Exploratory Data Analysis is majorly performed using the following methods:
- Univariate visualization — provides summary statistics for each field in the raw data set
- Bivariate visualization — is performed to find the relationship between each variable in the dataset and the target variable of interest
- Multivariate visualization — is performed to understand interactions between different fields in the dataset
- Dimensionality reduction — helps to understand the fields in the data that account for the most variance between observations and allow for the processing of a reduced volume of data. Through these methods, the data scientist validates assumptions and identifies patterns that will allow for the understanding of the problem and model selection and validates that the data has been generated in the way it was expected to. So, value distribution of each field is checked, a number of missing values is defined, and the possible ways of replacing them are found.
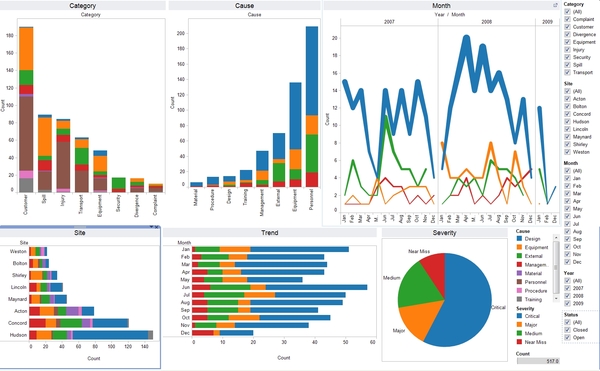
- Data Visualization- Data visualization is the graphical representation of information and data.
We also implemented linear regression from scratch on the dataset given by Vikram sir on the last day of the week and compared the results with those of Scikit implementation.
We also implemented linear regression from scratch on the dataset given by Vikram sir on the last day of the week and compared the results with those of Scikit implementation.

Comments
Post a Comment